AI impact on the job market
A Power BI dashboard over a 30,000-role dataset covering eight countries, built to make automation risk, projected openings and pay comparable across education levels and industries.
- Period
- October to December 2025
- Tools
- Power BI, DAX, Power Query
- Data
- 30,000 roles, 13 columns, eight countries
30,000
roles in the dataset
8
countries
13
columns per role
The data
Each row is a job role with thirteen attributes, not a job posting. The set covers eight countries with an even split between them, so no single country dominates and the United States is about an eighth of it.
| Country | Roles | Share |
|---|---|---|
| Australia | 3,802 | 12.7% |
| United Kingdom | 3,784 | 12.6% |
| Canada | 3,775 | 12.6% |
| China | 3,763 | 12.5% |
| Germany | 3,741 | 12.5% |
| Brazil | 3,728 | 12.4% |
| United States | 3,713 | 12.4% |
| India | 3,694 | 12.3% |
Beyond the job title itself, the columns carried per role are industry, job status, AI impact level, median salary, required education, years of experience required, current and projected openings, remote work ratio, automation risk, location and gender diversity.
What it shows
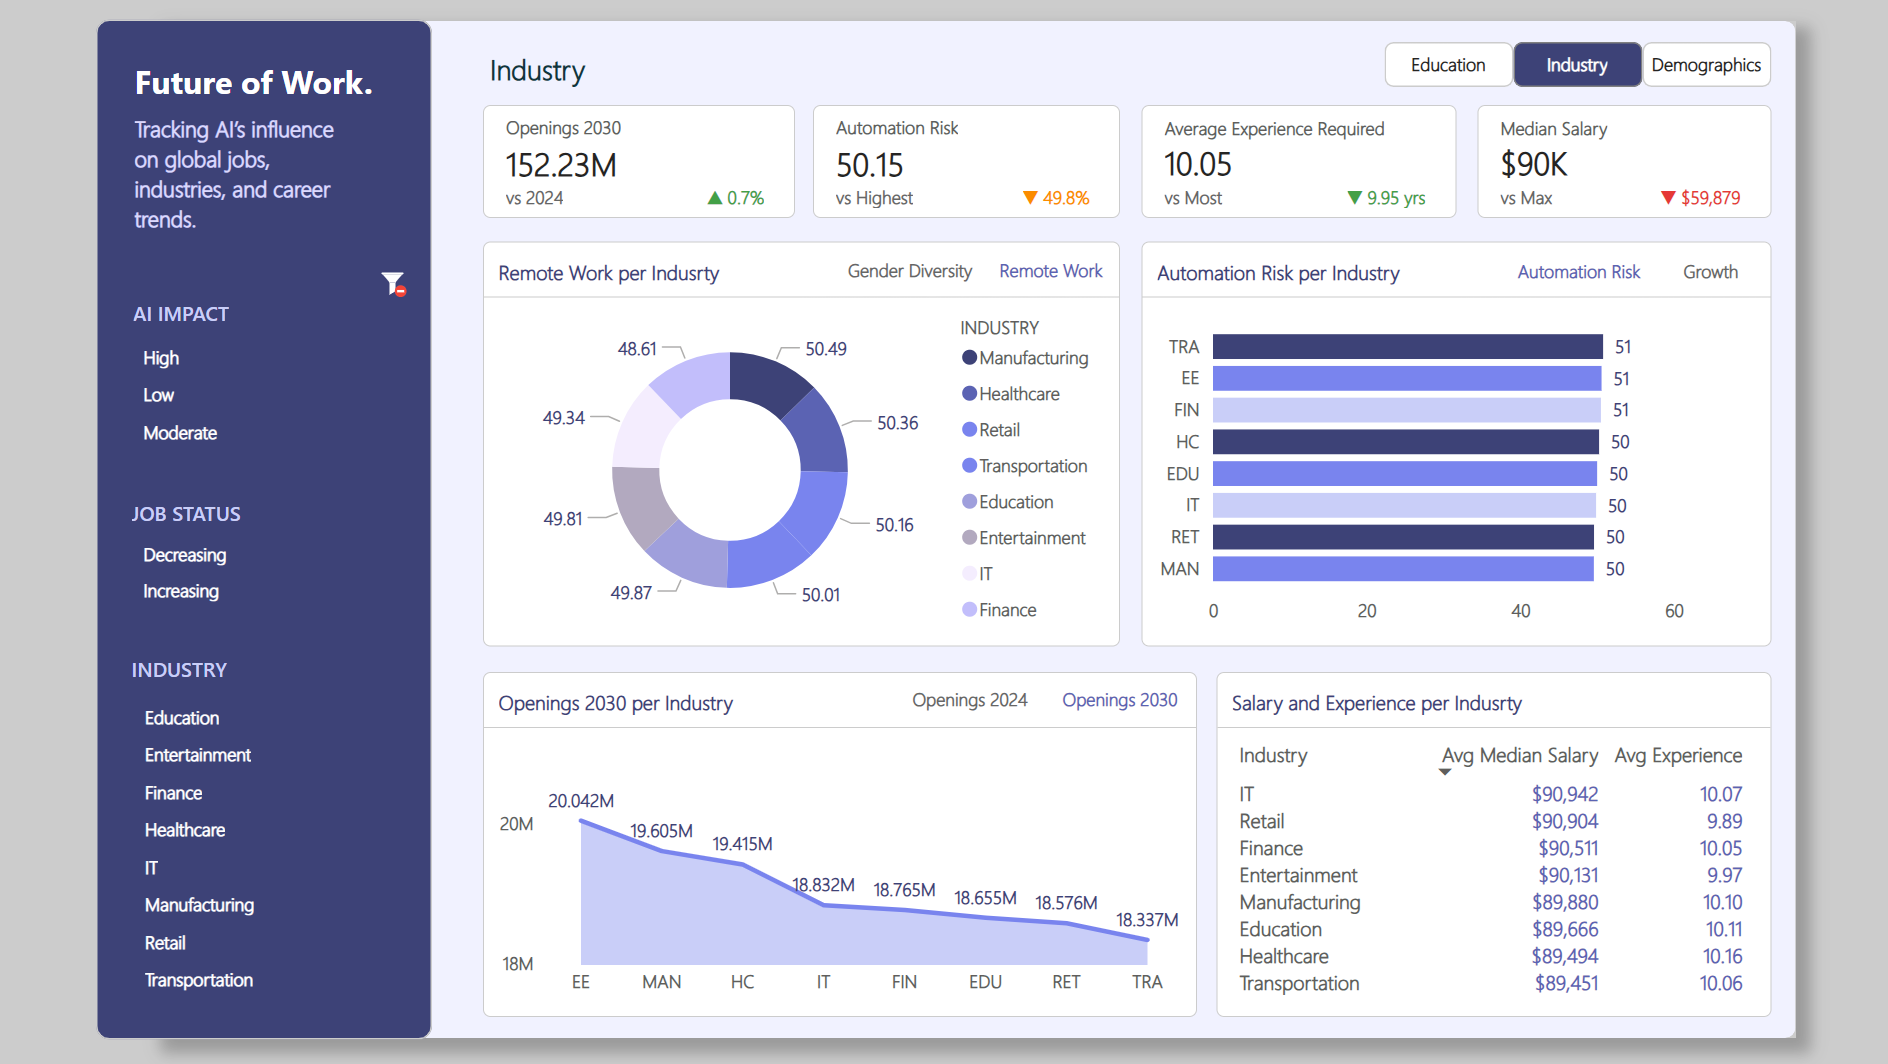
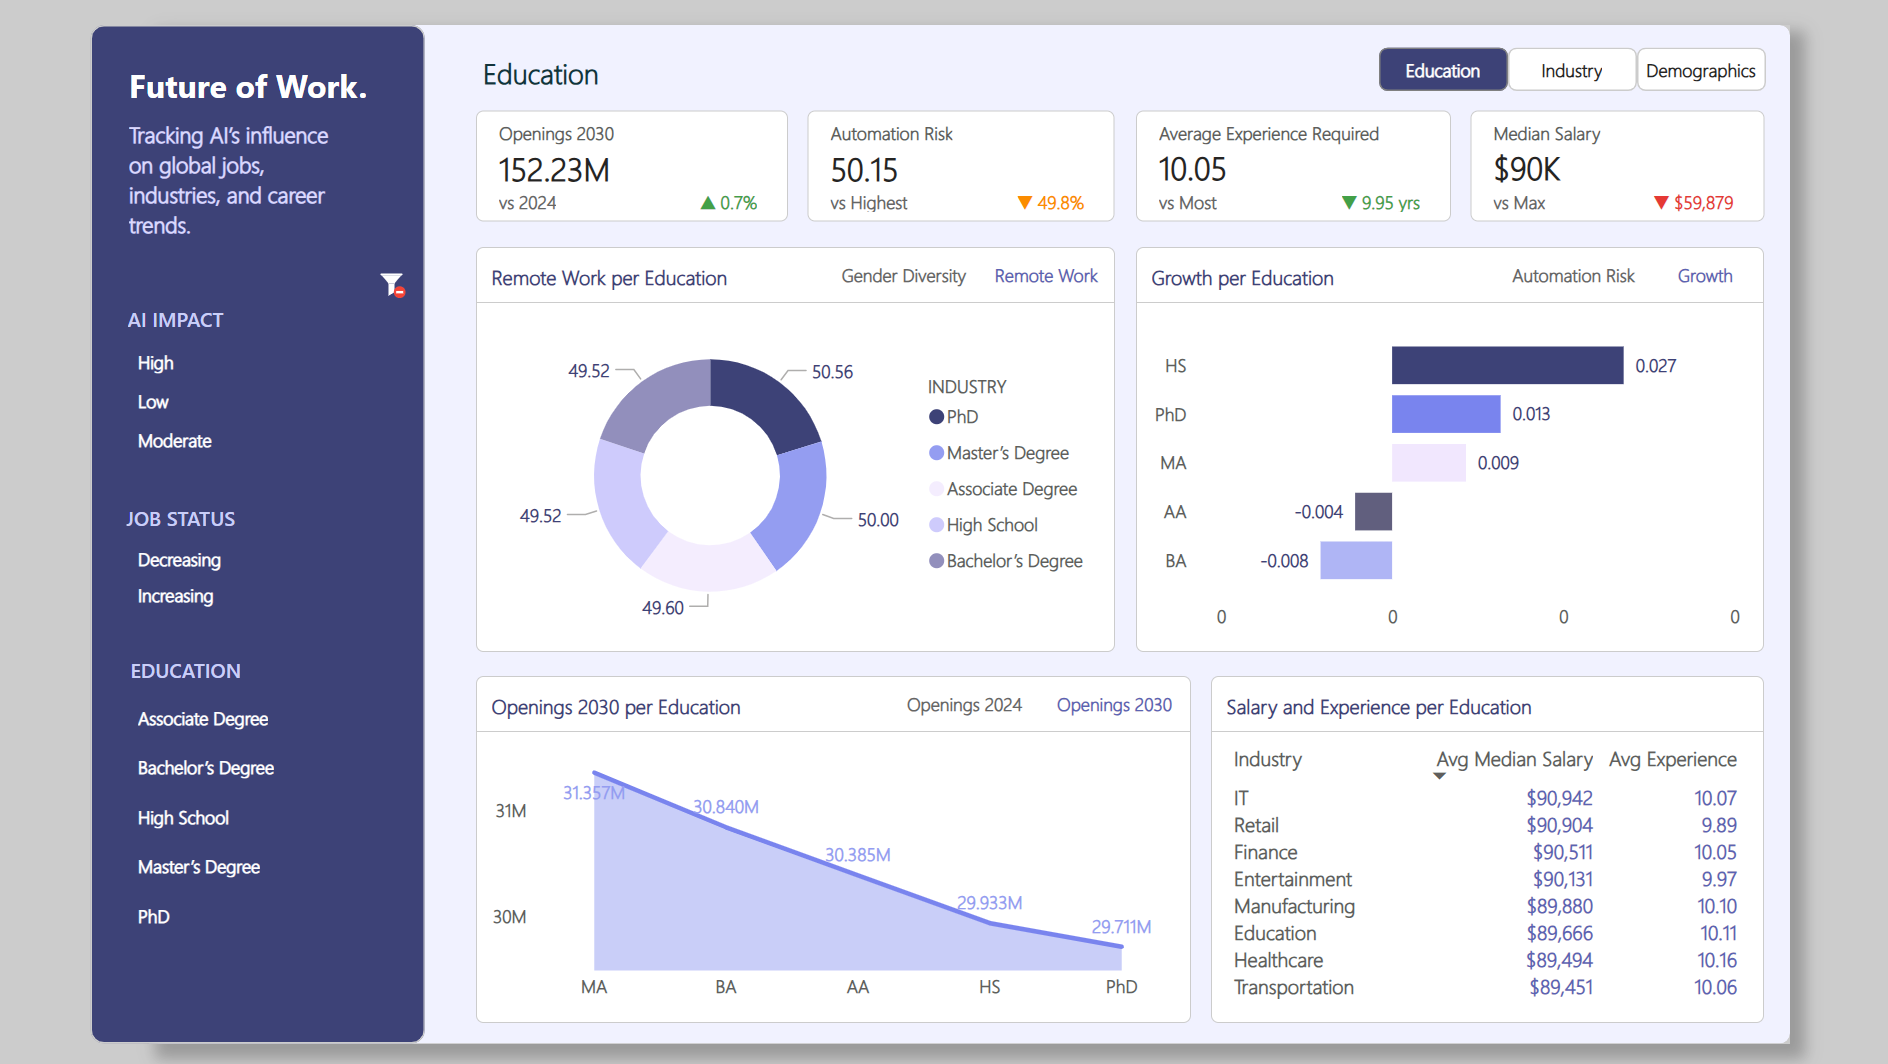
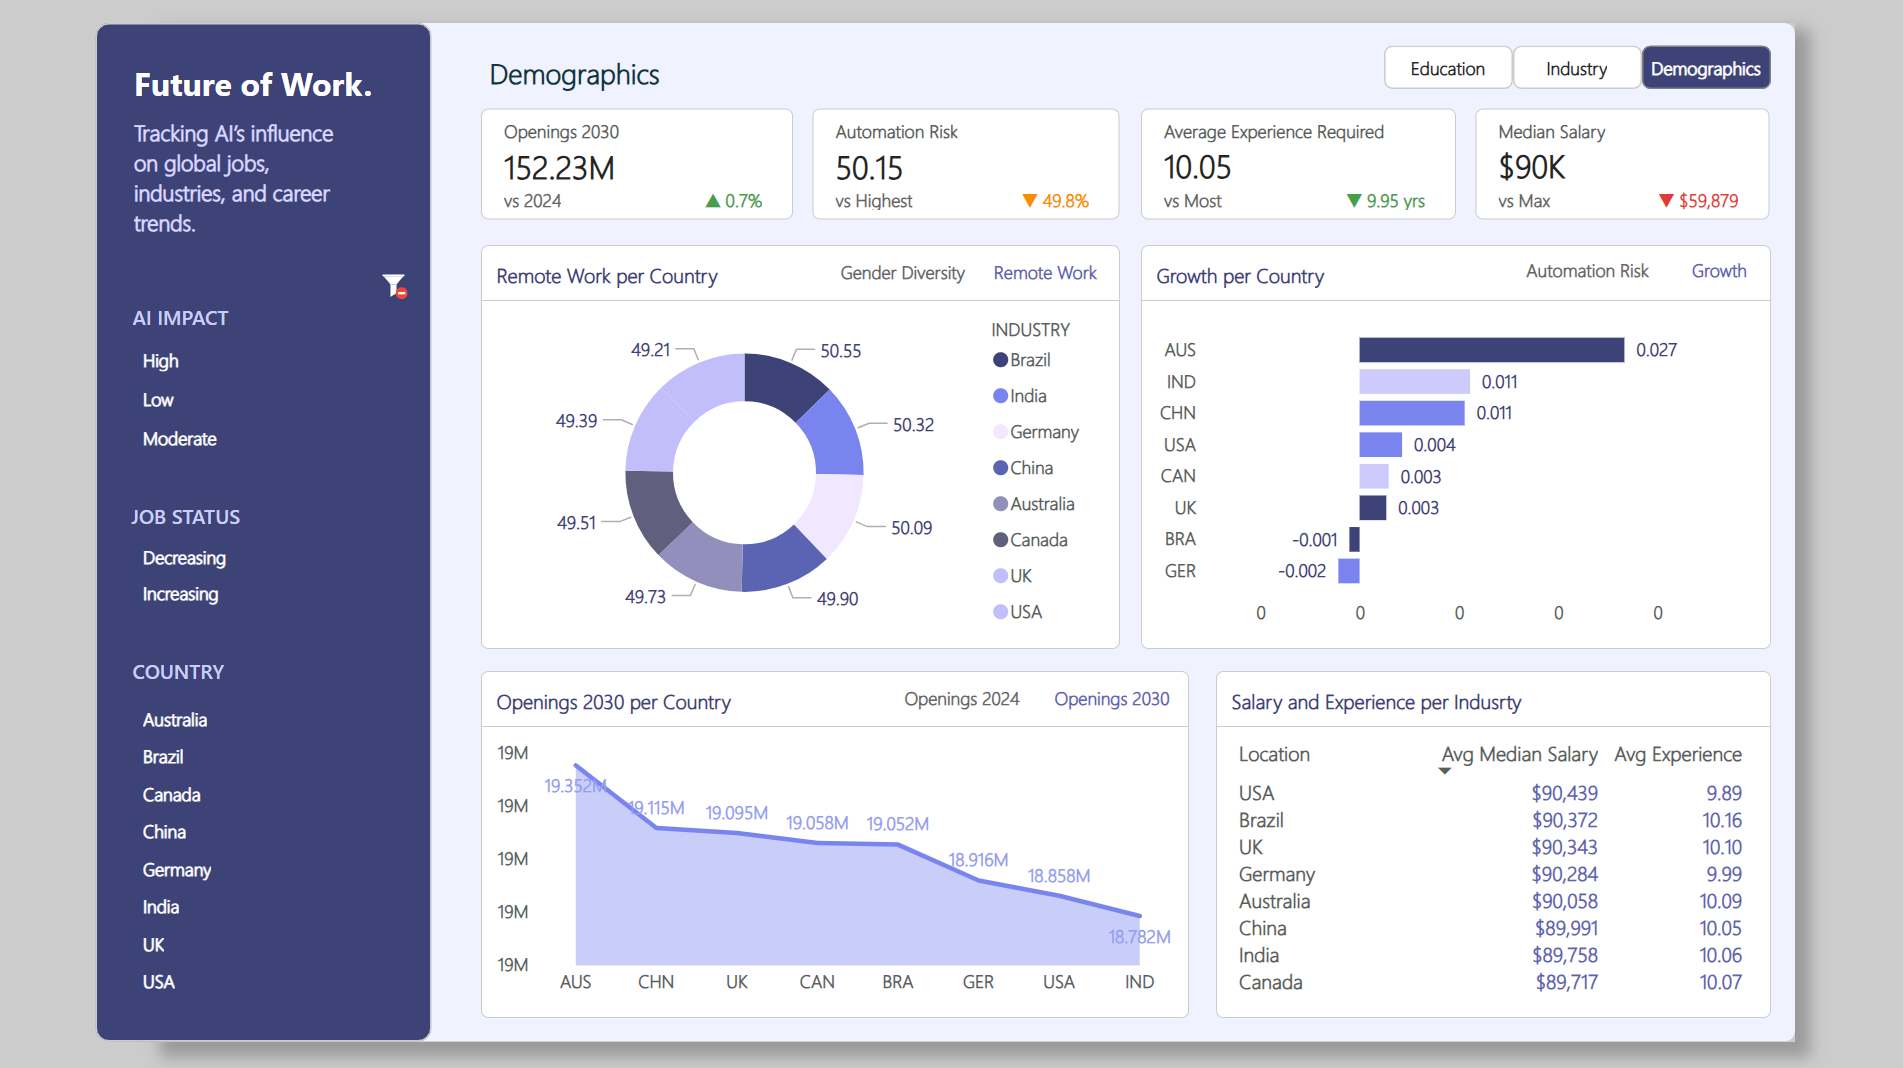
Automation risk is a column in the data rather than something the dashboard infers. It runs the full range from near zero to near certain, with a mean around 50%, so the question worth asking is which roles sit where, and against what pay and education.
Projected openings for 2030 sit alongside current openings, which lets a role be read as growing or shrinking rather than just large. DAX measures carry the comparisons so a reader can drill into a country, an industry or an education level without a new report being built for them.
What the numbers are, and are not
The projected openings column sums to more than 152 million across the dataset. That is a forecast total carried in the data, and it is not a count of anything collected, measured or analysed here.
A correction
An earlier version of this page described these rows as job postings, in United States terms, and at a magnitude taken from the forecast column rather than from the row count. All three were wrong, and the figures above are the corrected reading. It is recorded here rather than quietly edited.
Not published
The source dataset
Not published
Not published. It is held for verification of the figures on this page rather than for redistribution.